Problem
I am trying to leverage the new SQL Server 2005 DMVs for performance analysis. While they're very useful, it would be nice to be able to see graphical representations of the data collected by the DMVs. Is there a graphical utility within SQL Server I can use as well?
Solution
In SQL Server 2005 Service Pack 2, Microsoft introduced a new feature that affords DBAs the ability to run Custom Reports. This feature allows DBAs to run their own Reporting Services custom reports from within the SQL Server Management Studio. To leverage this feature, Microsoft has released a Performance Dashboard that you can download and use to identify performance issues in your database server. The dashboard abstracts the data that is collected from the SQL Server 2005 dynamic management views (DMVs). However, it should not be used as a substitute for learning the various DMVs and their purpose. Note that the custom reporting feature is only available as of Service Pack 2 of SQL Server 2005. Both your database server and the Management Studio must be at Service Pack level 2 or greater. You don't need Reporting Services installed to run the dashboard.
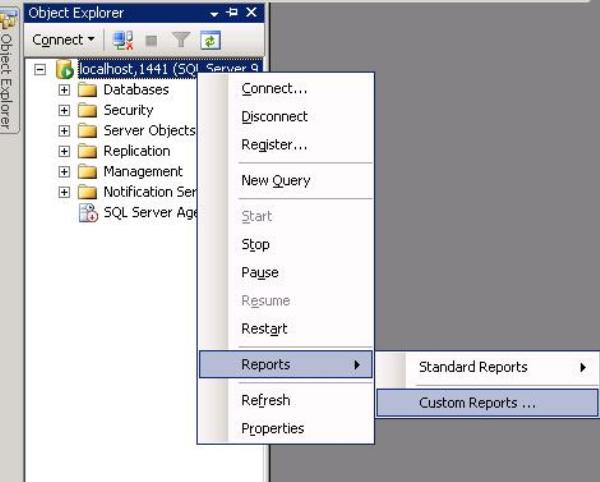
Open a Management Studio session and set your focus to the Object Explorer pane. Right clicking on any node will display a Reports option which leads to the Custom Reports option.
You can download the Performance Dashboard from the following link
http://www.microsoft.com/downloads/details.aspx?FamilyId=1d3a4a0d-7e0c-4730-8204-e419218c1efc&displaylang=en
The following is from the web-site in the above link:
Common performance problems that the dashboard reports may help to resolve include:
- CPU bottlenecks (and what queries are consuming the most CPU)
- IO bottlenecks (and what queries are performing the most IO)
- Index recommendations generated by the query optimizer (missing indexes)
- Blocking
- Latch contention
The name of the download file from the above link is DownloadSQLServer2005_PerformanceDashboard.msi. It is a Windows installer file that, when executed, will create a folder named PerformanceDashboard on your server. If you choose the default location, the installer will place the files in the following default location on the server: C:\Program Files\Microsoft SQL Server\90\Tools\PerformanceDashboard.
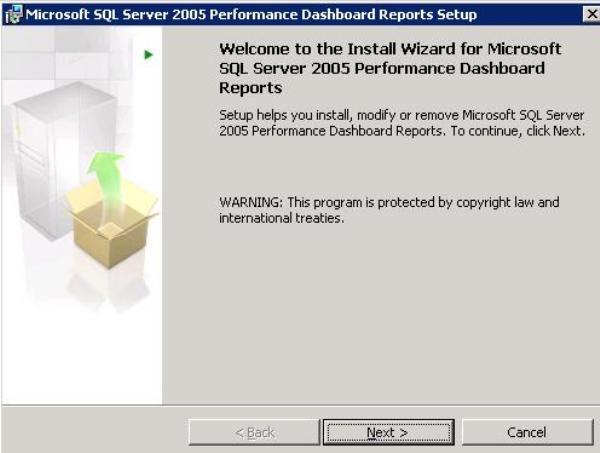
Double clicking the installer, we're presented with the Welcome screen. Click Next.
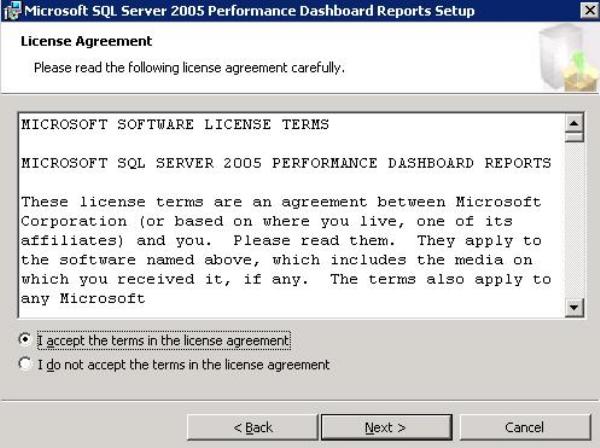
We're presented with License Agreement screen. Enter your license information and click Next.
We're presented with a registration screen. Enter your registration information and click Next.
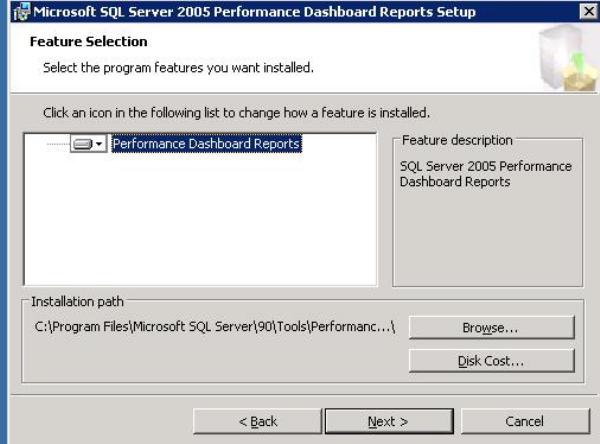
Accept the default features by clicking Next
We're now ready to install. Click Install
Installation is now complete!
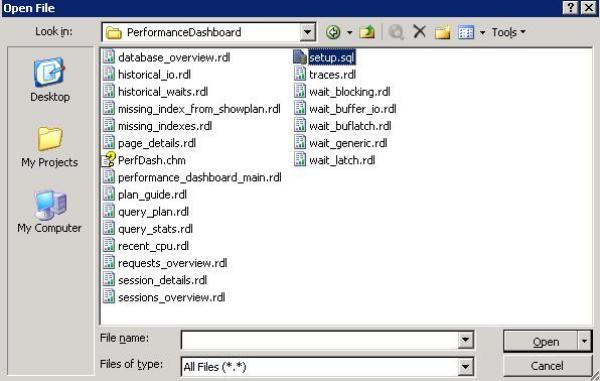
Now that the Dashboard has been installed, we need to set our server up to run it. Open a new query window within SQL Server Management Studio. Navigate to the location to where you chose to install the dashboard files (the default is C:\Program Files\Microsoft SQL Server\90\Tools\PerformanceDashboard). Execute script setup.sql. This script will connect to the msdb database and install everything needed to run custom reports.
Once you've run the set up script, you're ready to run the custom report. Right click on any node in the Object Explorer and click on Custom Reports...
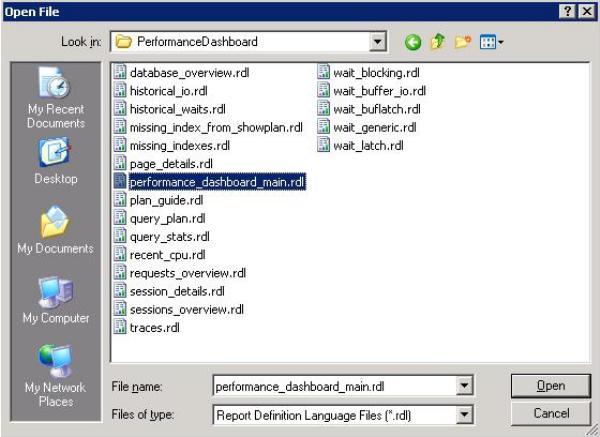
A file search dialog box will open. Navigate to the folder where you installed the dashboard files. The dashboard report file is performance_dashboard_main.rdl.
Once you open the .rdl file via the dialog, you're presented with the following warning screen.
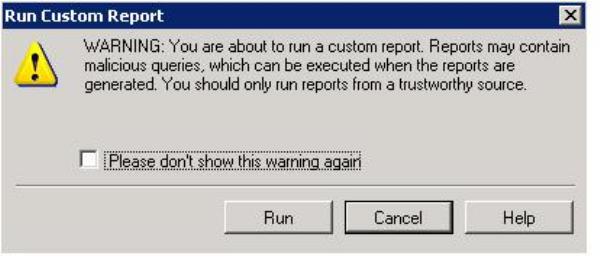
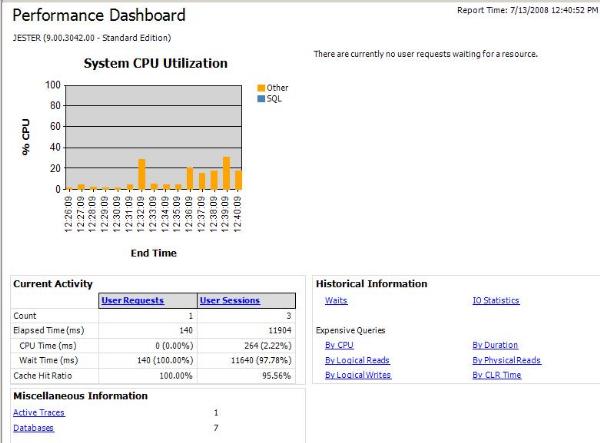
Clicking Run in the warning dialog, we're presented with the report!