Google
 

Friday, January 25, 2008

Gathering I/O statistics down to the database file level

When managing your SQL Server environment there are many aspects that need to be reviewed to determine where the bottlenecks are occurring to ensure you are getting the best performance possible. SQL Server offers many great tools and functions to determine issues with locking, blocking, fragmentation, missing indexes, deadlocks, etc... In addition, to looking at all of these areas another area of concern is I/O. Disk I/O can be tracked at the OS level by using counters in Performance Monitor, but these counters give you an overall picture of what is occurring on the server. What other options are available to look at I/O related information down to the file level for each database?

Solution
As mentioned above, SQL Server offers many great little functions and utility programs to help you gain an insight as to what is occurring on the server. One of these tools is fn_virtualfilestats.

This function, fn_virtualfilestats allows you to get information for each physical file that is being used to hold your data including both the data and log files. The function returns read and write information as well as stall information, which is the time users had to wait for an I/O operation to complete. Each time this function is called it returns the overall numbers that SQL Server has collected since the last time the database engine was started, so to use this effectively you need to gather data from two different points of time and then do a comparison.

To run this function to get data for all databases and all files this can be done as easily as this:

SQL 2005

SELECT * FROM fn_virtualfilestats(NULL,NULL);

SQL 2000

SELECT * FROM :: fn_virtualfilestats(-1, -1)

The output for SQL 2000 and 2005 is pretty much the same, but some additional columns have been added for SQL Server 2005.

Column Name Notes Description
DbId
Database ID.
FileId
File ID.
TimeStamp
Database timestamp at which the data was taken.
NumberReads
Number of reads issued on the file.
BytesRead
Number of bytes read issued on the file.
IoStallReadMS SQL2005 only Total amount of time, in milliseconds, that users waited for the read I/Os to complete on the file.
NumberWrites
Number of writes made on the file.
BytesWritten
Number of bytes written made on the file.
IoStallWriteMS SQL2005 only Total amount of time, in milliseconds, that users waited for the write I/Os to complete on the file.
IoStallMS
Sum of IoStallReadMS and IoStallWriteMS.
FileHandle
Value of the file handle.
BytesOnDisk SQL2005 only Physical file size (count of bytes) on disk.

For database files, this is the same value as size in sys.database_files, but is expressed in bytes rather than pages.

For database snapshot spare files, this is the space the operating system is using for the file.

(Source SQL Server 2005 Books Online)

Sample Output

As you can see from the sample output, the Dbid and FileId columns are pretty cryptic. The Dbid can be be translated to the database name pretty easily by using the DB_NAME() function, but the fileId needs to be looked up from one of the system tables.

To lookup the filename from the system tables you can use these queries.

SQL 2005

SELECT dbid, fileid, filename
FROM sys.sysaltfiles
WHERE dbid = 5 and fileid in (1,2)

SQL 2000

SELECT dbid, fileid, filename
FROM dbo.sysaltfiles
WHERE dbid = 5 and fileid in (1,2)

Here is sample output.

From just using this function directly you can gather data from two different points in time and then do a comparison to determine the change that has occurred between these two periods of time. Here is a sample query that gathers data, waits for a period of time and then gathers data again to show you a comparison.

This example is written for SQL Server 2005, but can easily be changed for SQL 2000.

USE master
GO

-- create table
IF NOT EXISTS (SELECT *
FROM sys.objects
WHERE OBJECT_ID = OBJECT_ID(N'[dbo].[filestats]')
AND
type IN (N'U'))
BEGIN
CREATE TABLE
filestats
(dbname VARCHAR(128),
fName VARCHAR(2048),
timeStart datetime,
timeEnd datetime,
timeDiff bigint,
readsNum1 bigint,
readsNum2 bigint,
readsBytes1 bigint,
readsBytes2 bigint,
readsIoStall1 bigint,
readsIoStall2 bigint,
writesNum1 bigint,
writesNum2 bigint,
writesBytes1 bigint,
writesBytes2 bigint,
writesIoStall1 bigint,
writesIoStall2 bigint,
ioStall1 bigint,
ioStall2 bigint
)
END

-- clear data
TRUNCATE TABLE dbo.filestats

-- insert first segment counters
INSERT INTO dbo.filestats
(dbname,
fName,
TimeStart,
readsNum1,
readsBytes1,
readsIoStall1,
writesNum1,
writesBytes1,
writesIoStall1,
IoStall1
)
SELECT
DB_NAME(a.dbid) AS Database_name,
b.filename,
GETDATE(),
numberReads,
BytesRead,
IoStallReadMS,
NumberWrites,
BytesWritten,
IoStallWriteMS,
IoStallMS
FROM
fn_virtualfilestats(NULL,NULL) a INNER JOIN
sysaltfiles b ON a.dbid = b.dbid AND a.fileid = b.fileid
ORDER BY
Database_Name

/*Delay second read */
WAITFOR DELAY '000:01:00'

-- add second segment counters
UPDATE dbo.filestats
SET
timeEnd = GETDATE(),
readsNum2 = a.numberReads,
readsBytes2 = a.BytesRead,
readsIoStall2 = a.IoStallReadMS ,
writesNum2 = a.NumberWrites,
writesBytes2 = a.BytesWritten,
writesIoStall2 = a.IoStallWriteMS,
IoStall2 = a.IoStallMS,
timeDiff = DATEDIFF(s,timeStart,GETDATE())
FROM
fn_virtualfilestats(NULL,NULL) a INNER JOIN
sysaltfiles b ON a.dbid = b.dbid AND a.fileid = b.fileid
WHERE
fName= b.filename AND dbname=DB_NAME(a.dbid)

-- select data
SELECT
dbname,
fName,
timeDiff,
readsNum2 - readsNum1 AS readsNumDiff,
readsBytes2 - readsBytes2 AS readsBytesDiff,
readsIoStall2 - readsIOStall1 AS readsIOStallDiff,
writesNum2 - writesNum1 AS writesNumDiff,
writesBytes2 - writesBytes2 AS writesBytesDiff,
writesIoStall2 - writesIOStall1 AS writesIOStallDiff,
ioStall2 - ioStall1 AS ioStallDiff
FROM dbo.filestats

Summary
One problem that you may be faced with though is that not all files are stored on their own physical disks, so you may have a case where you want to look at things from a drive perspective vs. at an individual file level. Here is a previous article written by Andy Novick that has the entire process broken down into functions, so you can aggregate things to a drive perspective. The article can be found here, Examining SQL Server's I/O Statistics

Friday, January 18, 2008

Ways to get I/O Statistics

Reading and writing to the disk is the heart of what any database management system does, SQL Server included. Input/Output (I/O) performance can make or break an application. This article discusses the diagnostic tools that can be used to examine SQL Server's I/O statistics so that you can make fact-based judgments about disk configurations.

There are several ways to request I/O statistics from SQL Server such as the System Statistical functions, sp_monitor, and fn_virtualfilestats. Each method has its advantages and disadvantages. I'll show you how they work and their pros and cons.

I rely primarily on fn_virtualfilestats because it gives the most detailed information. The other methods aggregate information at the instance level. The instance level may be the only meaningful alternative when 'you are accounting for the CPU, but when working with file I/O having the detailed breakdown is helpful.

One of the limitations of all of system statistical functions and fn_virtualfilestats is that their reports are always based on the resources consumed since the instance started. This includes both peak usage times and low usage times. If your instance has been running through several cycles of peak to low usage these overall aggregates may be of some interest, but they are usually most interesting during times of peak usage. After we discuss the various methods for statistics gathering, I will show you a stored procedure for gathering I/O statistics during peak time periods.

Ways to get I/O Statistics

Although the statistics are nearly identical, there are several ways to request them from SQL Server 2000. The methods are:

  • The system statistical functions such as @@CPU_BUSY
  • sp_monitor
  • fn_virtualfilestats

The first two methods give you information that is aggregated at the instance level. Let's take a look at them first.

Using the System Statistical Functions

The system statistical functions cover I/O, network and CPU resource utilization. Table 1 lists them.

Table 1 System Statistical Functions

Function

Description
@@CONNECTIONS The number of connections or attempted connections.
@@CPU_BUSY Timer ticks that the CPU has been working for SQL Server.
@@IDLE Time in timer ticks that SQL Server has been idle.
@@IO_BUSY Timer ticks that SQL Server has spent performing I/O operations.
@@PACKET_ERRORS Number of network packet errors that have occurred.
@@PACK_RECEIVED Number of packets read from the network.
@@PACK_SENT Number of packets written to the network.
@@TIMETICKS Number of millionths of a second in a timer tick.
@@TOTAL_ERRORS Number of read/write errors during I/O operations.
@@TOTAL_READ Number of disk reads.
@@TOTAL_WRITE Number of disk writes.

For monitoring I/O the most interesting numbers are @@IO_BUSY, @@Total_READ and @@TOTAL_WRITE. Here is a simple query that shows the raw statistics:

-- Take a look at raw I/O Statistics
SELECT @@TOTAL_READ [Total Reads]
, @@TOTAL_WRITE as [Total Writes]
, CAST(@@IO_BUSY as FLOAT) * @@TIMETICKS / 1000000.0 as [IO Sec]
GO
(Results)
Total Reads Total Writes IO Sec 
----------- ------------ -----------
85336 322109 25.375

When using the functions @@IO_BUSY, @@CPU_BUSY, and @@IDLE, the function returns clock ticks. To convert ticks to seconds, multiply by @@TIMERTICKS and then divide by one million. Be sure to convert the quantities to floating point, numeric, or bigint to avoid integer overflow during intermediate calculations.

The raw numbers alone aren't very interesting. 'It is more informative to turn the numbers into rates. To do that you need to know how long the instance has been running. This next script uses a user-defined function (UDF), udf_SQL_StartDT, which uses the start time of the Lazy Writer process as a proxy for the start time of the instance. udf_SQL_StartDT is available from my free T-SQL UDF of the Week Newsletter Volume 1 #11.

The start time is turned into a number of seconds and the script performs the division, being careful to CAST to data types that 'will not lose information due to rounding or integer division:

-- Turn the raw statistics into rates
DECLARE @SecFromStart bigint
SET @SecFromStart = DATEDIFF(s, dbo.udf_SQL_StartDT(), getdate())

SELECT CAST(CAST(@@TOTAL_READ as Numeric (18,2))/@SecFromStart
as Numeric (18,2)) as [Reads/Sec]
, CAST(CAST(@@TOTAL_WRITE as Numeric (18,2))/@SecFromStart
as Numeric (18,2)) as [Writes/Sec]
, CAST(@@IO_BUSY * @TIMETICKS/10000.0/@SecFromStart
as Numeric (18,2)) as [Percent I/O Time]
GO
(Results)
Reads/Sec            Writes/Sec           Percent I/O Time    
-------------------- -------------------- --------------------
24.34 92.53 .42

The read and write rates are often in the tens or hundreds, at least over short time spans. You might ask, "Why do you bother to retain even two digits to the right of the decimal?" Most of the time these extra two digits do not come into play. However, when a system has been idle for a long time, let's say over the weekend after being restarted on Friday night, it's possible to have rates that are less than one. Showing zero for the rates is confusing, so I have tried to be sure that at least a small number shows up.

Showing rates from the time the instance started until the query is run forces you to average over a long time period. SQL Server supplies a stored procedure that shows the values of the system statistical functions since it was last run, this let's you get a quick snapshot of your I/O rates.

sp_monitor is a system stored procedure that produces four recordsets that display the values of system statistical functions since sp_monitor was last run. It also shows the last_run time, the current_run time, and the number of seconds in the measurement. There are no parameters to sp_monitor. Here is a short script to see its output:

-- run sp_monitor
sp_monitor
go
(Results)
last_run                       current_run                    seconds    
------------------------------ ------------------------------ -------
2003-08-03 13:52:50.000 2003-08-03 13:52:53.000 3

cpu_busy io_busy idle
----------------- --------------- ------------------
498(0)-0% 773(0)-0% 276153(2)-66%

packets_received packets_sent packet_errors
------------------ ------------------ ----------------
826(1) 1741(1) 0(0)

total_read total_write total_errors connections
------------- ------------- -------------- -------------
139818(0) 392372(1) 0(0) 52(0)

sp_monitor uses the system statistical functions discussed in the previous section to get its information. It stores the value from the last time the procedure was invoked in the table spt_monitor in the master database.

Each of the measurements, such as cpu_busy and total_read, are character strings that have several parts. The first number is the measurements from when the instance started. The second number, the one in parenthesis, is the measurement since the last time sp_monitor was run. Finally, for the CPU related measurements in the second recordset, the percentage of time in the column's category follows.

I generally find the sp_monitor is the best way to get a quick picture of what is happening to your system; just: run it, wait 10 to 100 seconds and run it again. The result is a snapshot of your system activity.

Other than getting a quick look at your system, several factors weigh against trying to use sp_monitor for long-term information gathering:

  • There is only one set of statistics that can be saved at a time. If someone else runs sp_monitor while you're waiting, you see the results since anyone last ran it.
  • The four recordsets of output are difficult to work with in T-SQL.
  • Combining the measurement from the instance startup time with the current measurement, and possibly a percentage also makes the output difficult to work with from a program.
  • The numbers are aggregated to the instance level.

These factors combine to limit the usefulness of the procedure. I generally use a system build-in function, fn_virtualfilestats, to get a more detailed look at Input/Output statistics.

Using fn_virtualfilestats to Get I/O Statistics

fn_virtualfilestats returns a table of I/O statistics at the file level. It takes two parameters: the Db_ID of a database to retrieve information for and the file_id of the file to retrieve information for. Supplying -1 to either of the parameters asks for all information about the dimension. For example, executing this query:

     select * from ::fn_virtualfilestats(-1, -1)

asks for information about all files in all databases. Executing

select * from ::fn_virtualfilestats(-1, 2)

asks for information about file number 2, usually the first log file, for all databases.

Table 2 lists the output columns for fn_virtualfilestasts. All measurements are "since the instance started."

Table 2 Output columns from fn_virtualfilestats

Column Data Type Description
Dbid Smallint Database ID from master..sysdatabases
FileID Smallint File ID from sysfiles
Timestamp Int Number of seconds since the instance started.
NumberReads Bigint Number of reads.
NumberWrites Bigint Writes.
BytesRead Bigint Bytes read.
BytesWritten Bigint Bytes written.
IoStallMS Bigint Milliseconds users waited for I/O complete on the file.

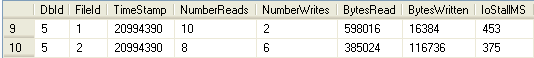
Here is a short query that shows the I/O statistics for the current database with sample output:

-- Get information about the current files
DECLARE @myDBID int
SET @myDBID = db_id()
SELECT * FROM ::fn_virtualfilestats (@myDBID, -1)
go
(Results)
DbId FileId TimeStamp NumberReads NumberWrites BytesRead  BytesWritten IoStallMS
---- ------ --------- ----------- ------------ ---------- ------------ ---------
16 1 288070359 134585 195377 6172327936 8675352576 833376
16 2 288070359 390 191536 2158592 11449939968 6384

The raw numbers are useful, but they are even more interesting when aggregated in different ways. Some of the ways that you might want to aggregate are:

  • For the system as a whole
  • By database
  • By drive
  • By log files vs. data files

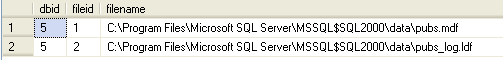
The following UDF, udf_Perf_FS_ByDriveTAB, aggregates the files by drive letter. It uses information in master..sysaltfiles to get the path to the physical file. Here is the CREATE FUNCTION script:

SET QUOTED_IDENTIFIER OFF
SET
ANSI_NULLS OFF
GO

CREATE FUNCTION dbo.udf_Perf_FS_ByDriveTAB (

@DriveLetter CHAR(1) = NULL -- Drive or NULL for all
) RETURNS TABLE
/*
* Returns a table of statistics by Drive letters for all drives
* with database files in this instance. They must match
* @Driveletter (or NULL for all). Returns one row for each
* Drive. Information about physical files is taken from
* master..sysaltfiles which has the physical file name needed.
* Warning: Drive letters do not always correspond to physical
* disk drives.
*
* Example:
select * from dbo.udf_Perf_FS_ByDriveTAB (default)
****************************************************************/

AS RETURN

SELECT TOP 100 PERCENT WITH TIES
LEFT
(saf.[Filename], 1) + ':' as DriveLetter
, Count(saf.FileID) as NumFiles
, CAST (Sum(saf.[size] / 128.0) as numeric(18,3)) as SizeMB
-- convert to Megabytes from 8-k pages
, Sum(NumberReads) as NumberReads
, Sum(NumberWrites) as NumberWrites
, Sum(BytesRead) as BytesRead
, Sum(BytesWritten) as BytesWritten
, Sum(IoStallMS) as IoStallMS
, Avg(vfs.[TimeStamp]/1000) as SecondsInMeasurement
FROM ::fn_virtualfilestats(-1, -1) vfs -- -1 = all db & files
inner join master..sysaltfiles saf
on vfs.DbId = saf.DbId
and vfs.FileID = saf.FileID
WHERE (@DriveLetter is NULL
OR LEFT(saf.[Filename], 1) = @DriveLetter)
GROUP BY LEFT(saf.[Filename], 1) + ':'
ORDER BY DriveLetter asc -- by Drive letter C, D, ....
GO

The parameter to udf_Perf_FS_ByDriveTAB is a drive letter, which you can use if you are only interested in information about a single drive. Otherwise, use NULL to retrieve information for all drives that have SQL Server data or log files.

Here is the result of executing it on a test server:

-- Get input output by drive
SELECT DriveLetter as Drive, NumFiles as Files, SizeMB
, NumberReads as Reads, NumberWrites as Writes
, BytesRead, BytesWritten, IOStallMS
, SecondsInMeasurement as Sec
FROM dbo.udf_Perf_FS_ByDriveTAB (default)
GO
(Results)
Drive Files SizeMB     Reads    Writes  BytesRead  BytesWritten IoStallMS Sec
----- ----- ---------- -------- ------- ---------- ------------ --------- -------
D: 47 5032.625 140293 392340 6258849792 20267508224 11024112 290955

E: 21 6004.125 340876 882233 9558932367 43481143983 13666091 290955

The most important factor needed to analyze these numbers is knowledge of the disk configuration that is associated with each drive letter. Is it a single drive? Is there a RAID configuration? If so, which one? Are there multiple partitions on any of the drives? A SAN? The answers to all of these questions make a big difference in how you evaluate the results. Different configurations, such as RAID 0 vs. RAID 5, have different capacities and you will have to know your configuration to make meaningful comparisons.

There are other ways to aggregate the output of fn_virtuafilestasts. You will find one such alternative in a user-defined function udf_Perf_FS_byDBTab

A problem with the numbers produced by fn_virtualfilestats is that they include information from the start of the instance. The numbers during peak usage are more interesting and the next section develops a solution to gathering them that is similar to the solution used by sp_monitor.

Friday, January 11, 2008

Optimize Parameter Driven Queries with the OPTIMIZE FOR Hint

SQL Server doesn't always select the best execution plan for your queries and thankfully there are several different hints that can be used to force SQL Server into using one execution plan over another. One issue that you may be faced with is when using parameters in your WHERE clause, sometimes the query runs great and other times it runs really slow. I recently had a situation where the hard coded values in the WHERE clause worked great, but when I changed the values to parameters and used the exact same values for the parameters the execution plan drastically changed and the overall time it took to run the query increased by about 5 times. This situation is referred to as parameter sniffing where SQL Server stores the values used as part of the execution plan and therefore other queries with different values may act totally different. So what options are there to get around this.

Solution
As mentioned above, SQL Server offers many hints that can be used to force how an execution plan is put together. The option that we are interested in is the OPTIMIZE FOR option. This will allow us to specify what parameter value we want SQL Server to use when creating the execution plan. This is a SQL Server 2005 hint.

Let's take a look at a few examples. These were all done against the AdventureWorks database.

Example 1

This first example is a straight query using a parameter without the OPTIMIZE FOR hint.

DECLARE @Country VARCHAR(20)
SET @Country = 'US'

SELECT *
FROM Sales.SalesOrderHeader h, Sales.Customer c,
Sales.SalesTerritory t
WHERE h.CustomerID = c.CustomerID
AND c.TerritoryID = t.TerritoryID
AND CountryRegionCode = @Country

The following is the actual execution plan that is generated to execute this query.

The overall cost for this query is 1.31871.

Example 2

In this example we are specifying the OPTIMIZE FOR hint which is shown in the last line of this query. The first part is identical to the query in Example 1. In this example we are telling SQL Server to optimize this execution plan for this query using "CA" as the parameter value.

DECLARE @Country VARCHAR(20)
SET @Country = 'US'

SELECT *
FROM Sales.SalesOrderHeader h, Sales.Customer c,
Sales.SalesTerritory t
WHERE h.CustomerID = c.CustomerID
AND c.TerritoryID = t.TerritoryID
AND CountryRegionCode = @Country
OPTION (OPTIMIZE FOR (@Country = 'CA'))

The following is the actual execution plan that is generated to execute this query. For the most part this query plan looks the same as the query plan above, except that the percentages in some tasks are a bit different.

The overall cost for this query is 1.1805 which is better then example 1.

Example 3

In this example we have changed the OPTIMIZE FOR value to be "US" instead of "CA", everything else is the same.

DECLARE @Country VARCHAR(20)
SET @Country = 'US'

SELECT *
FROM Sales.SalesOrderHeader h, Sales.Customer c,
Sales.SalesTerritory t
WHERE h.CustomerID = c.CustomerID
AND c.TerritoryID = t.TerritoryID
AND CountryRegionCode = @Country
OPTION (OPTIMIZE FOR (@Country = 'US'))

The following is the actual execution plan that is generated to execute this query. As you can see SQL Server has changed this quite a bit from examples 1 and 2.

The overall cost for this query is 1.160652 which is not as good as the first two examples.

Client Stats

In addition to the above, we also captured the client statistics with each execution. The trial # corresponds with the example #. In the below grid we can see the Total Execution time increased with each run. For example1 the total time was 328, for example2 was 406 and for example3 it was 468. This shows that for this query SQL Server seems to be picking the best query plan.

Note: the procedure cache was not cleared between each run.

Summary

As you can see from this simple test when using parameters, using the OPTIMIZE FOR hint can change the query plan. This may have a positive impact or a negative impact, but this gives you another option to adjust how your queries execute especially if things start performing poorly when using parameters in your queries.

As I mentioned above, the dataset I was working on had tables with 20+ million rows. Here are the query plan costs that I had for each option:

  • hard coded values - 4.44821
  • parameters with same values - 2722.9
  • using OPTIMIZE hint - 4.44649

Without the OPTIMIZE hint some executions were fast and others took a long time. So depending on your dataset and the task at hand this option may or may not help.

Wednesday, January 2, 2008

Storing I/O Stats at Meaningful Intervals

Analyzing I/O statistics gathered during peak usage is much more informative than trying to work with numbers that included both peak and off-peak times of day. The solution presented in this section stores the raw information provided by fn_virtualfilestats in a way that provides information in a user selected time slice. To accomplish this task, I have created a table, dbaFilestats, and a stored procedure usp_Perf_FilestatGathering that I run every day as a scheduled job.

DbaFilestats is a table that I keep in my DBA database for gathering the statistics. Here is the CREATE TABLE script:

CREATE TABLE dbo.dbaFilestats (
ID int IDENTITY (1, 1) NOT NULL ,
dbid int NOT NULL ,
fileid int NOT NULL ,
Reads bigint NULL ,
Reads_FromStart bigint NULL ,
Writes bigint NULL ,
Writes_FromStart bigint NULL ,
BytesRead bigint NULL ,
BytesRead_FromStart bigint NULL ,
BytesWritten bigint NULL ,
BytesWritten_FromStart bigint NULL ,
IostallMS bigint NULL ,
IostallMS_FromStart bigint NULL ,
RecordedDT datetime NULL ,
timestamp bigint NULL ,
IntervalMSec bigint NULL ,
FirstMeasure_FromStart bit NULL
)

I've chosen to keep both the interval measures, such as Reads and BytesWritten, and the measures from the instance startup (%_FromStart). It is possible to do away with the _FromStart numbers by keeping them in a temporary table as the stored procedure runs, but I have found that every so often, I want to see them.

The stored procedure to perform the information gathering is dba_Perf_FilestatGathering. It takes four parameters, which are listed in Table 3.

Table 3 Parameters to dba_Perf_FilestatGathering

Parameter Data Type Description
@Duration Datetime The amount of time to collect data.
@IntervalSec Int The interval in seconds between data gathering.
@WhichDB Int DB_ID of the database to gather for. -1 for all databases.
@WhichFile Int File_ID to gather information for. -1 for all files.

To create the procedure on your system, you will need a UDF, udf_DT_AddTime, which you will find at this URL: http://www.novicksoftware.com/UDFofWeek/Vol1/T-SQL-UDF-Volume-1-Number-38-udf_DT_Addtime.htm. Here is the CREATE PROC script:

CREATE PROC dbo.dba_Perf_FilestatGathering

@Duration datetime = '01:00:00' -- Duration of data collection
-- long time gathers forever

, @IntervalSec int = 600 -- Approx sec in the gathering interval
, @WhichDB int = -1 -- DB_ID to monitor, -1 for all
, @WhichFile int = -1 -- File_ID of file to monitor, -1 for all
/*
* Procedure to monitor fn_virtualfilestats and record their value at
* intervals in the dbaFilestats table.
*
* Example:
-- TRUNCATE TABLE DBAFILESTATS
DECLARE @RC int, @StartTime datetime, @thisDBID int
SELECT @StartTime = getdate(), @thisDBID = db_id()
EXEC @RC = dba_Perf_FilestatGathering '00:10:21', 60, @ThisDBID , 1
select * from dbafilestats where RecordedDT > @StartTime
and dbid=@thisDBID and fileid = 1 Order by ID
********************************************************************/

AS

DECLARE @TerminateGatheringDT datetime -- when to stop gathering
, @WaitFor_Interval datetime
, @LastRecordingDT datetime
, @RecordingDT datetime
, @myDBID int
, @myError int -- Local copy of @@ERROR
, @myRowCount int -- Local copy of @@RowCount
, @msgText nvarchar(4000) -- for error messages


SELECT @WaitFor_Interval = DATEADD (s, @IntervalSec
, CONVERT (datetime, '00:00:00', 108)
)
, @TerminateGatheringDT =
dbo.udf_DT_AddTime (getdate(), @Duration)
, @myDBID = db_id()

WHILE getdate() <= @TerminateGatheringDT BEGIN

SELECT @LastRecordingDT = @RecordingDT
SELECT @RecordingDT = getdate() --

-- Get Stats for All files
INSERT INTO dbo.dbaFilestats (
dbid
, fileid
, Reads
, Reads_FromStart
, Writes
, Writes_FromStart
, BytesRead
, BytesRead_FromStart
, BytesWritten
, Byteswritten_FromStart
, IOStallMS
, iostallMs_FromStart
, RecordedDT
, [timestamp]
, IntervalMSec
, FirstMeasure_FromSTart
)
SELECT vfs.dbid -- Database ID
, vfs.fileid -- File ID
, vfs.numberreads - dbaf.reads_fromstart as Reads
, vfs.numberreads as Reads_FromStart
, vfs.numberwrites - dbaf.writes_fromstart
as Writes
, vfs.numberwrites as Writes_FromStart
, vfs.bytesread - dbaf.bytesRead_FromStart
as BytesRead
, vfs.bytesread as BytesRead_FromStart
, vfs.bytesWritten - dbaf.BytesWritten_FromStart
as BytesWritten
, vfs.byteswritten as BytesWritten_FromStart
, vfs.IOStallMS - dbaf.IOStallMS_FromStart
as IOStallMS
, vfs.iostallms as IOStallMS_FromStart
, @RecordingDT
, vfs.[timestamp]
, CASE WHEN @LastRecordingDT IS NULL
THEN NULL
ELSE DATEDIFF
(ms, dbaf.RecordedDT, @RecordingDT)
END as IntervalMSec
, CASE WHEN @LastRecordingDT IS NULL THEN 1 ELSE 0 END
as
FirstMeasure_FromStart
FROM ::fn_virtualfilestats(@WhichDB , @WhichFile) vfs
LEFT OUTER JOIN dbaFilestats dbaf
ON vfs.dbid = dbaf.dbid and vfs.fileid = dbaf.fileid
WHERE (@LastRecordingDT IS NULL
OR dbaf.RecordedDT = @LastRecordingDT)
SELECT @myError = @@Error, @myRowCount = @@RowCount
IF @myError != 0 BEGIN
SET @msgText = 'Error ' + CONVERT(varchar(9), @myError)
+ ' in usp_FileStatGathering during INSERT'
RAISERROR (@msgText, 16, 1) WITH LOG
RETURN @myError
END

WAITFOR DELAY @WaitFor_Interval -- delay

END

I usually run for 10 minutes and 21 seconds ('00:10:21'), gathering information every 60 seconds for all databases (-1) and all files (-1). The reason for adding the 21 seconds to the 10 minutes is that I want 10 measurements and the 21 seconds allows for the time that it takes to make and store the measurements.

Let's take a look at some of the raw data from a run against my database 16, which had a fairly heavy load at the time:

SELECT Top 5 [ID], dbid, [fileid] as [File]
, Reads, Writes, BytesRead, BytesWritten, IOStallMS
, IntervalMSec as [MSec]
FROM dbaFilestats
WHERE FirstMeasure_FromStart = 0
ORDER BY [ID]
Go
(Results)
ID   dbid File   Reads Writes BytesRead BytesWritten IOStallMS MSec
---- ---- ----- ------ ------ --------- ------------ --------- ------
2 16 1 1243 564 35774464 25452544 74530 72846
3 16 1 1911 847 75489280 48136192 62485 64186
4 16 1 244 1356 37617664 53551104 3890 62263
5 16 1 1393 1315 64258048 38379520 40297 63500
6 16 1 152 1485 13426688 66273280 4733 62703

As you can see from the MSec column, it took longer than 60 seconds to get through each of the measurements. The actual time will depend on the load on the system and the number of databases.

Looking at the raw numbers from dbaFilestats is helpful. However, I find the most useful use of the information is to turn most of the measurements into rates. This query does the job:

SELECT Top 5 
CAST(Reads/(IntervalMSec/1000.0) as Numeric (18,2))
as [Reads/Sec]
, CAST(Writes/(IntervalMsec/1000.0) as Numeric (18,2))
as [Writes/Sec]
, (Reads+Writes) as [I/O Count]
, CAST((Reads+Writes)/(IntervalMsec/1000.0) as Numeric(18,2))
as [I/O /sec]
, Iostallms/CASE WHEN (reads+writes)>0
THEN reads+writes
ELSE 1 END AS [IoStallMS/Op]
FROM dbaFilestats
WHERE FirstMeasure_FromStart = 0
AND dbid = 16 and fileid=1
ORDER BY [id]
GO
(Results)
Reads/Sec   Writes/Sec   I/O Count  IO /sec    IoStallMS/Op
----------- ------------ --------- ---------- ------------
17.06 7.74 1807 24.81 41
29.77 13.20 2758 42.97 22
3.92 21.78 1600 25.70 2
21.94 20.71 2708 42.65 14
2.42 23.68 1637 26.11 2

These rates indicate that there may be a problem with the disk(s) that database 16 is using. I know that because of the high IoStallMS/Op measurement (IoStall Milliseconds per I/O operation). Anything over twenty indicates that there is some type of problem. That is in spite of the fact that the I/O rates are moderate, in the range of 25-43 per second. A modern server disk should be able to achieve 85 to 100 operations per second. The situation warrants further investigation.

Conclusion

Input/Output is at the heart of what SQL Server does. This article has shown several methods for getting I/O statistics from SQL Server as an aid in diagnosing performance issues. I find that the most useful technique is to gather statistics during peak usage at one-minute intervals. The key indicators are the I/O operations per second and the IoStallMS/Op. You might want to investigate other ratios for your server.